
AT&T’s fixed wireless expansion in the last BDC cycle wasn’t about reaching the unserved. It was about entering markets cable already owned.
The most important story in the latest FCC Broadband Data Collection data isn’t about rural connectivity. It’s about what happened inside cable’s existing footprint.
Between December 2024 and June 2025, AT&T Internet Air added approximately 630,000 new H3 market cells — the geographic units we use to track competitive supply at the local level. Of those, 84% were overbuild: markets where cable already had a broadband subscriber and AT&T moved in anyway.
That’s not gap-filling. That’s competitive entry.
The map makes it visible in a way that national subscriber counts don’t.
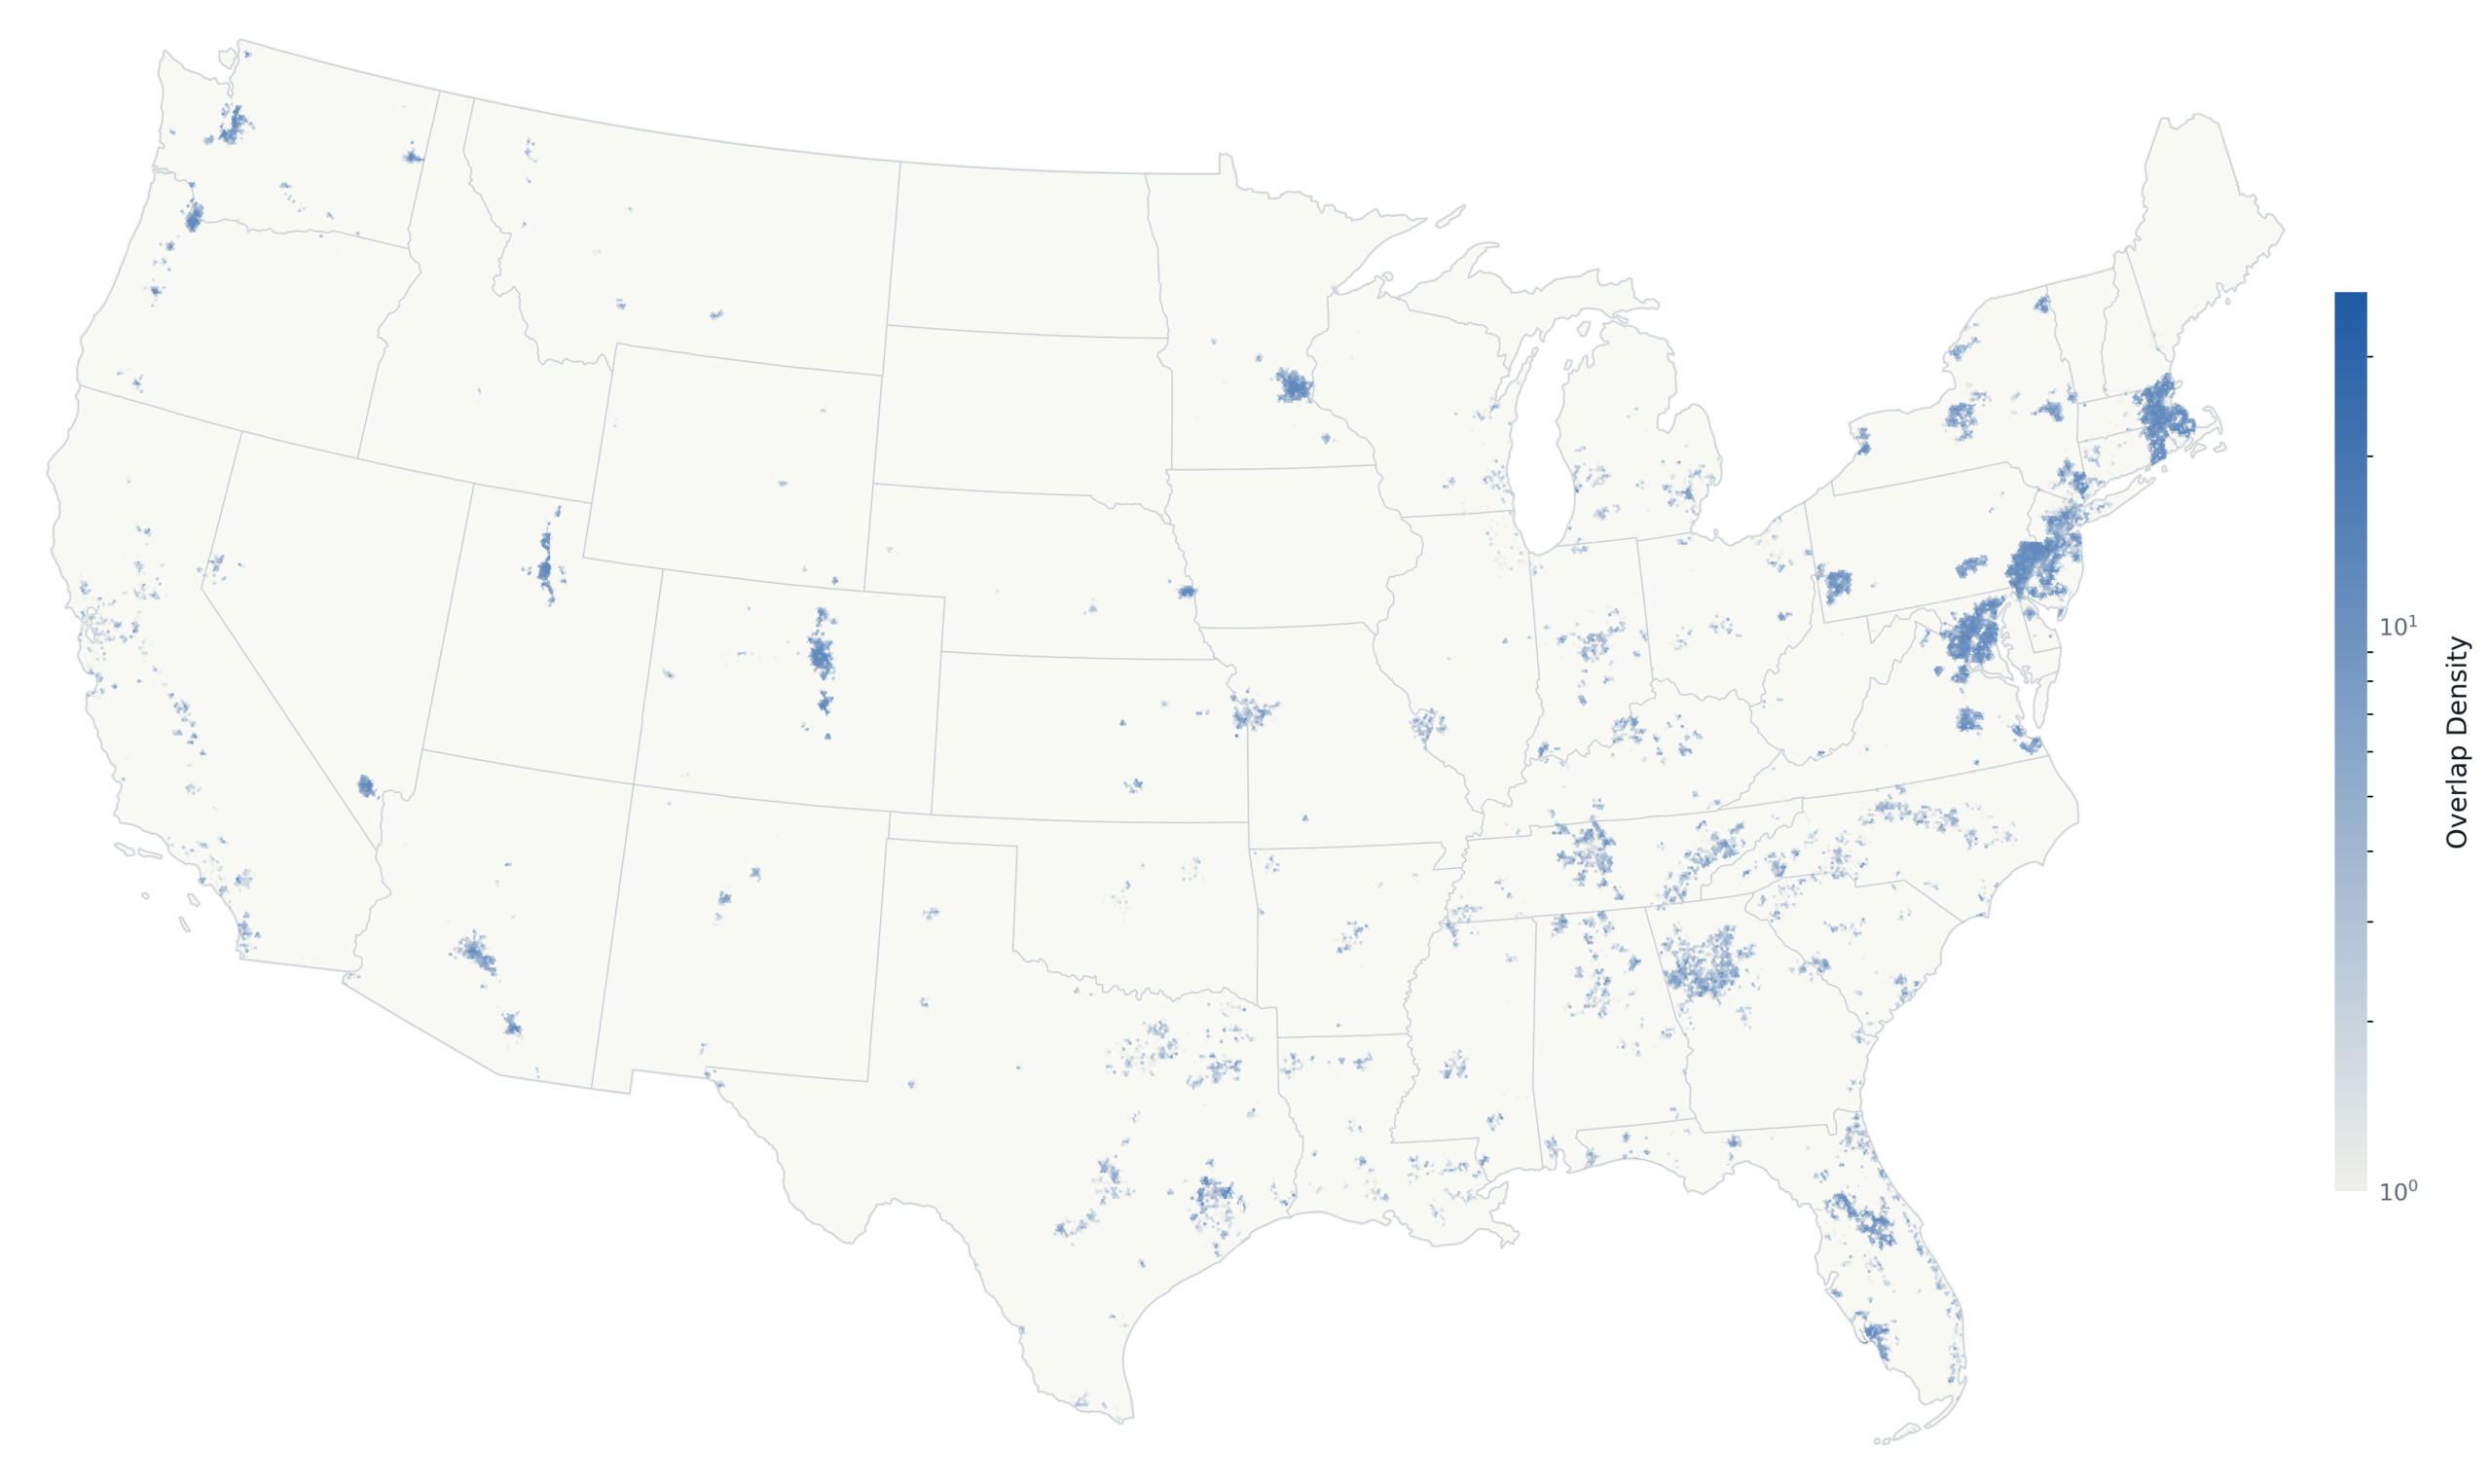
Cable + Fiber Overbuild, FCC BDC December 2024→June 2025
Source: BroadbandSignals.com analysis of FCC BDC D24→J25 availability changes. Maps show H3 resolution-8 market cells with newly reported cable-overlap conditions by access model. H3 cells are geographic units, not households, passings, subscribers, or population-weighted exposure.
The eastern concentration of new cable-fiber overbuild isn’t random — it traces AT&T’s fiber build corridors and the markets where Internet Air is serving as a bridge product ahead of the wireline build. The pattern is deliberate: establish a household relationship with a wireless broadband product, then migrate it to owned fiber where economics support the build.
T-Mobile and Verizon tell a different story. T-Mobile still has the broadest total FWA footprint nationally — about 1.27 million H3 cells — but added only 130,000 new cells in the same period. Verizon added 130,000 as well, with 80% overbuild concentration but in a more geographically selective pattern consistent with C-band capacity discipline.
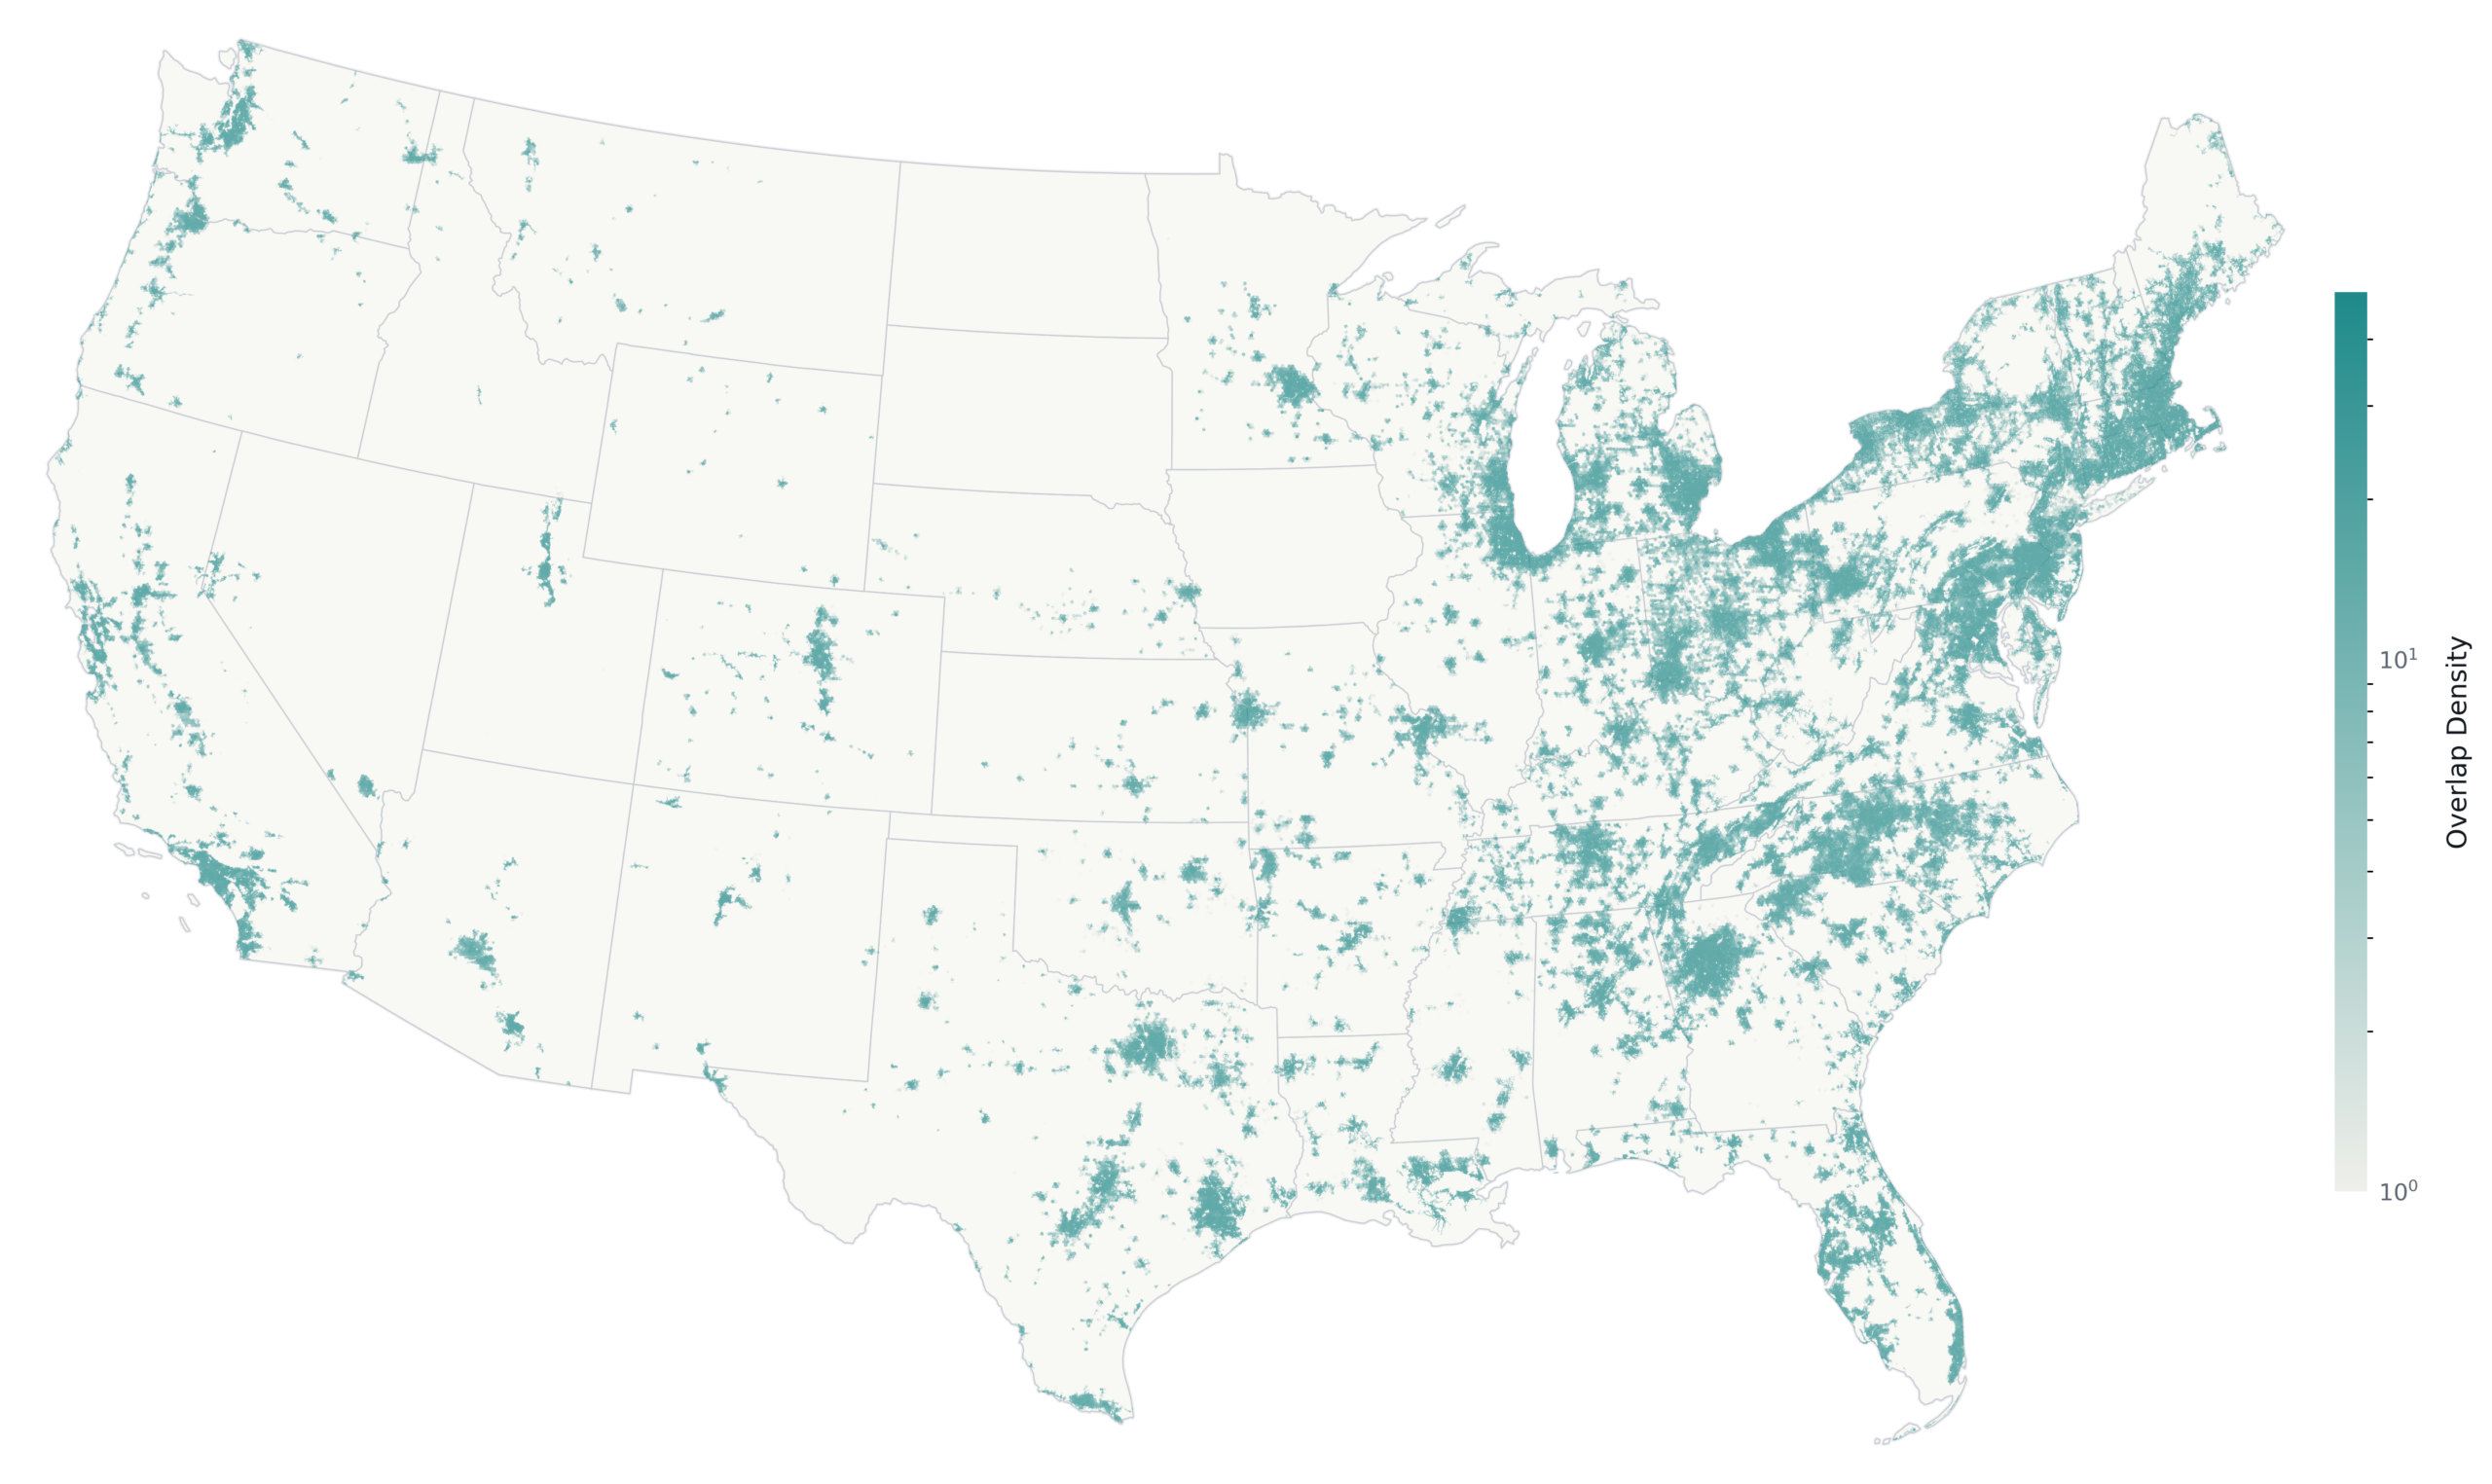
Cable + FWA Overbuild, FCC BDC December 2024→June 2025
Source: BroadbandSignals.com analysis of FCC BDC D24→J25 availability changes. Maps show H3 resolution-8 market cells with newly reported cable-overlap conditions by access model. H3 cells are geographic units, not households, passings, subscribers, or population-weighted exposure. FWA availability reflects BDC-reported coverage and may overstate practical sellable capacity where spectrum, cell loading, or backhaul constraints apply.
The competitive implication is asymmetric. T-Mobile creates the broad value substitute — widely available, low-friction, enough to give cost-sensitive households an exit. AT&T is pursuing something more targeted: entering specific contested markets with a product designed to anchor a household relationship that follows the fiber buildout. Those are different competitive threats to cable, operating through different mechanisms, and requiring different responses.
What the headline net-add numbers obscure is that the competitive geography has already shifted — and it shifted between reporting periods, not between earnings calls. By the time cable operators report the subscriber effect, the supply-side change has been in market for six to twelve months.
That lag is what makes footprint analysis the leading indicator and quarterly net adds the lagging one.
This analysis is drawn from the Q1 2026 FMC State of the Market report, which tracks competitive supply changes, overbuild intensity, and operator exposure across the full U.S. broadband market using FCC BDC data at H3 resolution. Subscribe or request sample pages →