
Q1 2026 · Flagship Report
Fixed-Mobile Convergence State of the Market
Subscriber Pressure Has Reached the Income Statement
What’s inside this issue
The Q1 2026 issue examines how subscriber pressure from FWA and fiber overbuild has begun showing up directly in cable operator income statements.
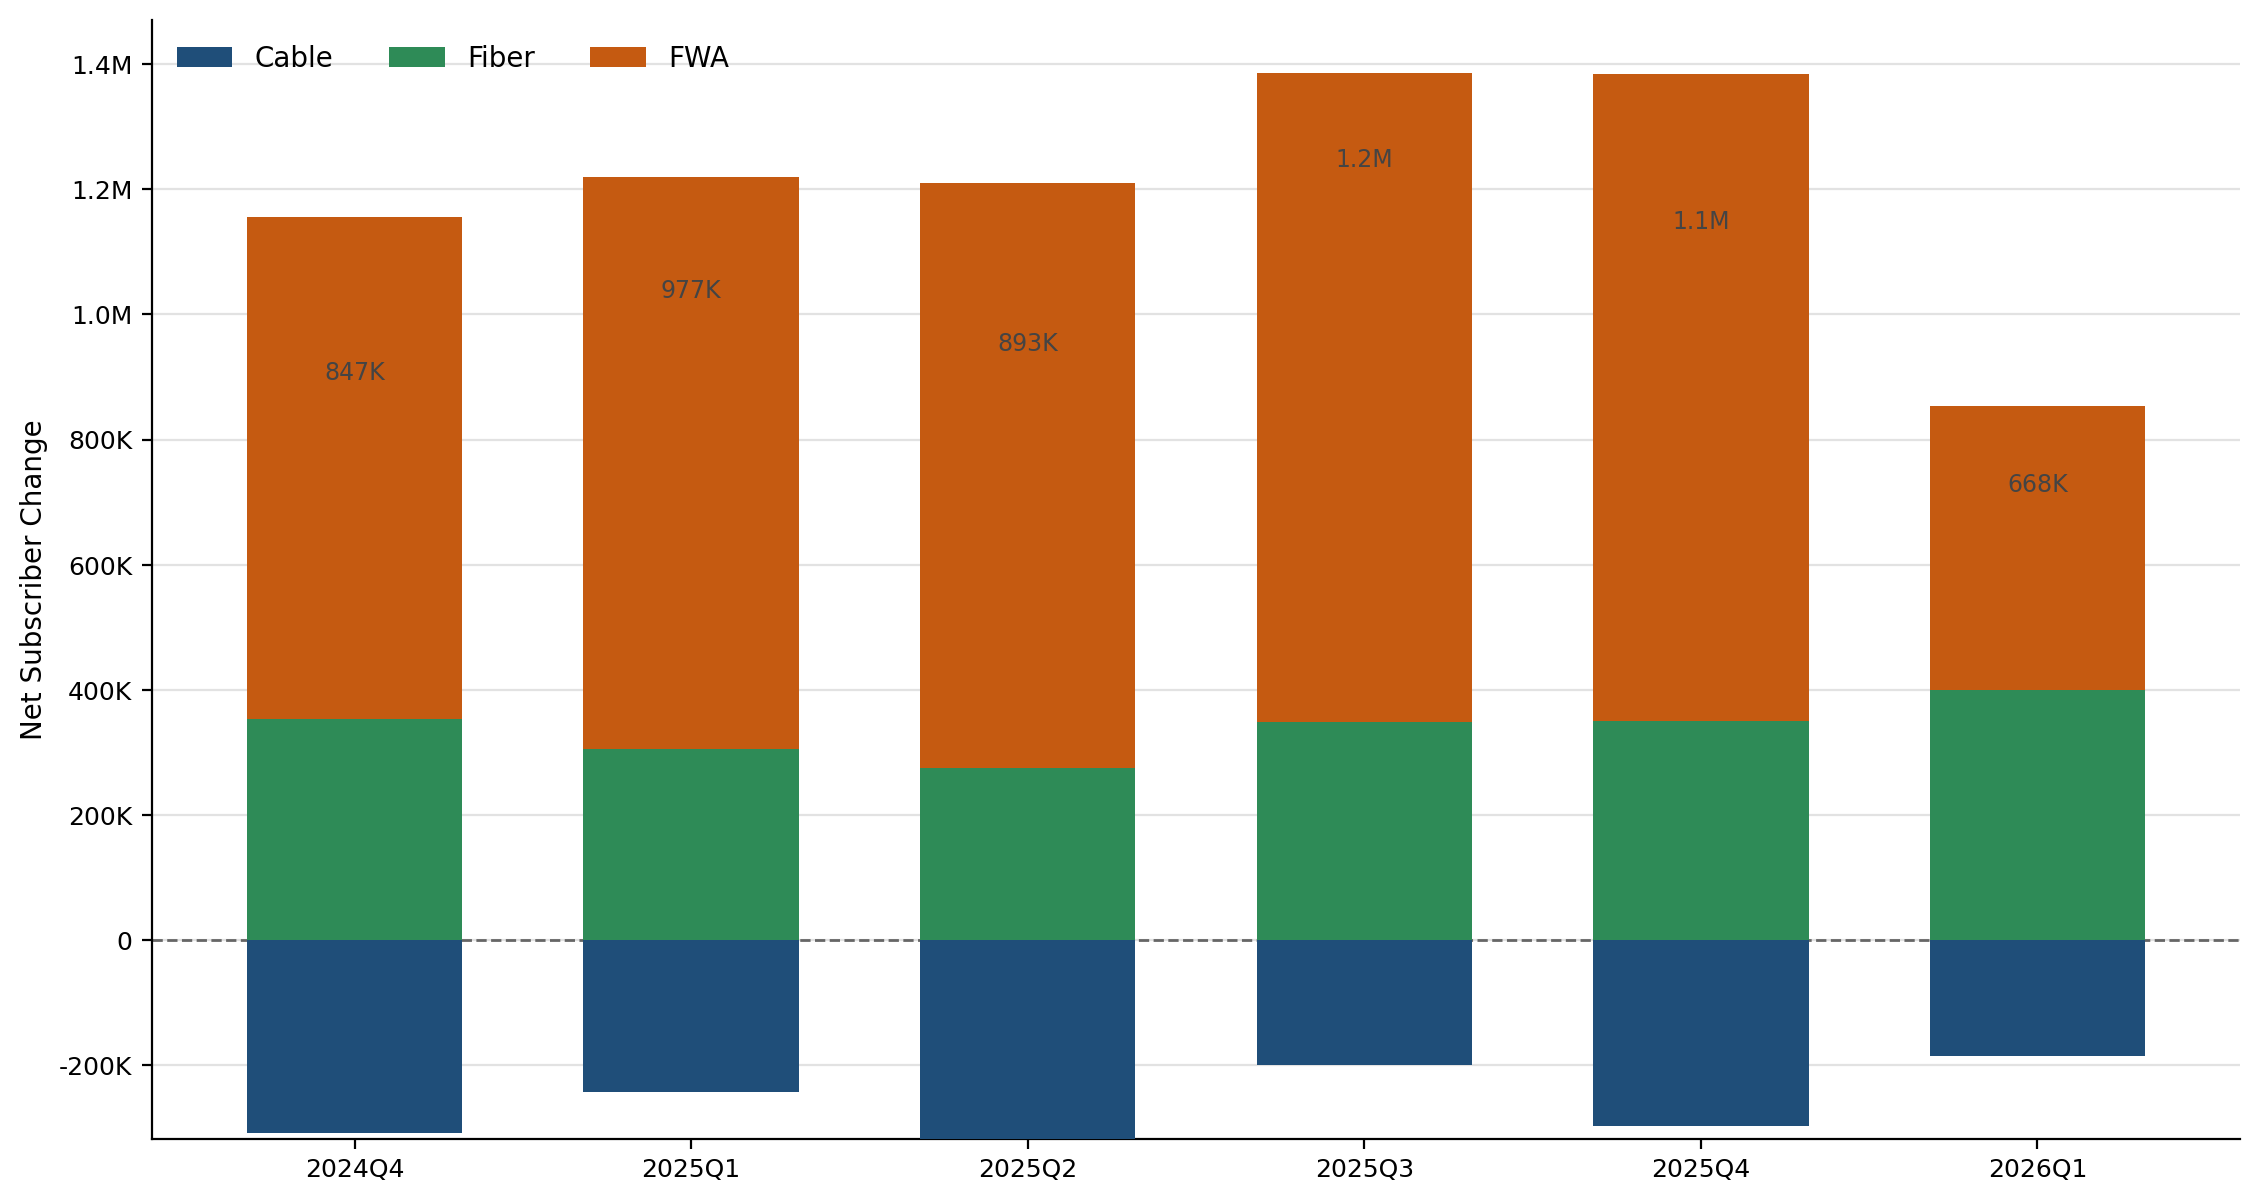
Exhibit 4 — Quarterly broadband net adds by access model through Q1 2026
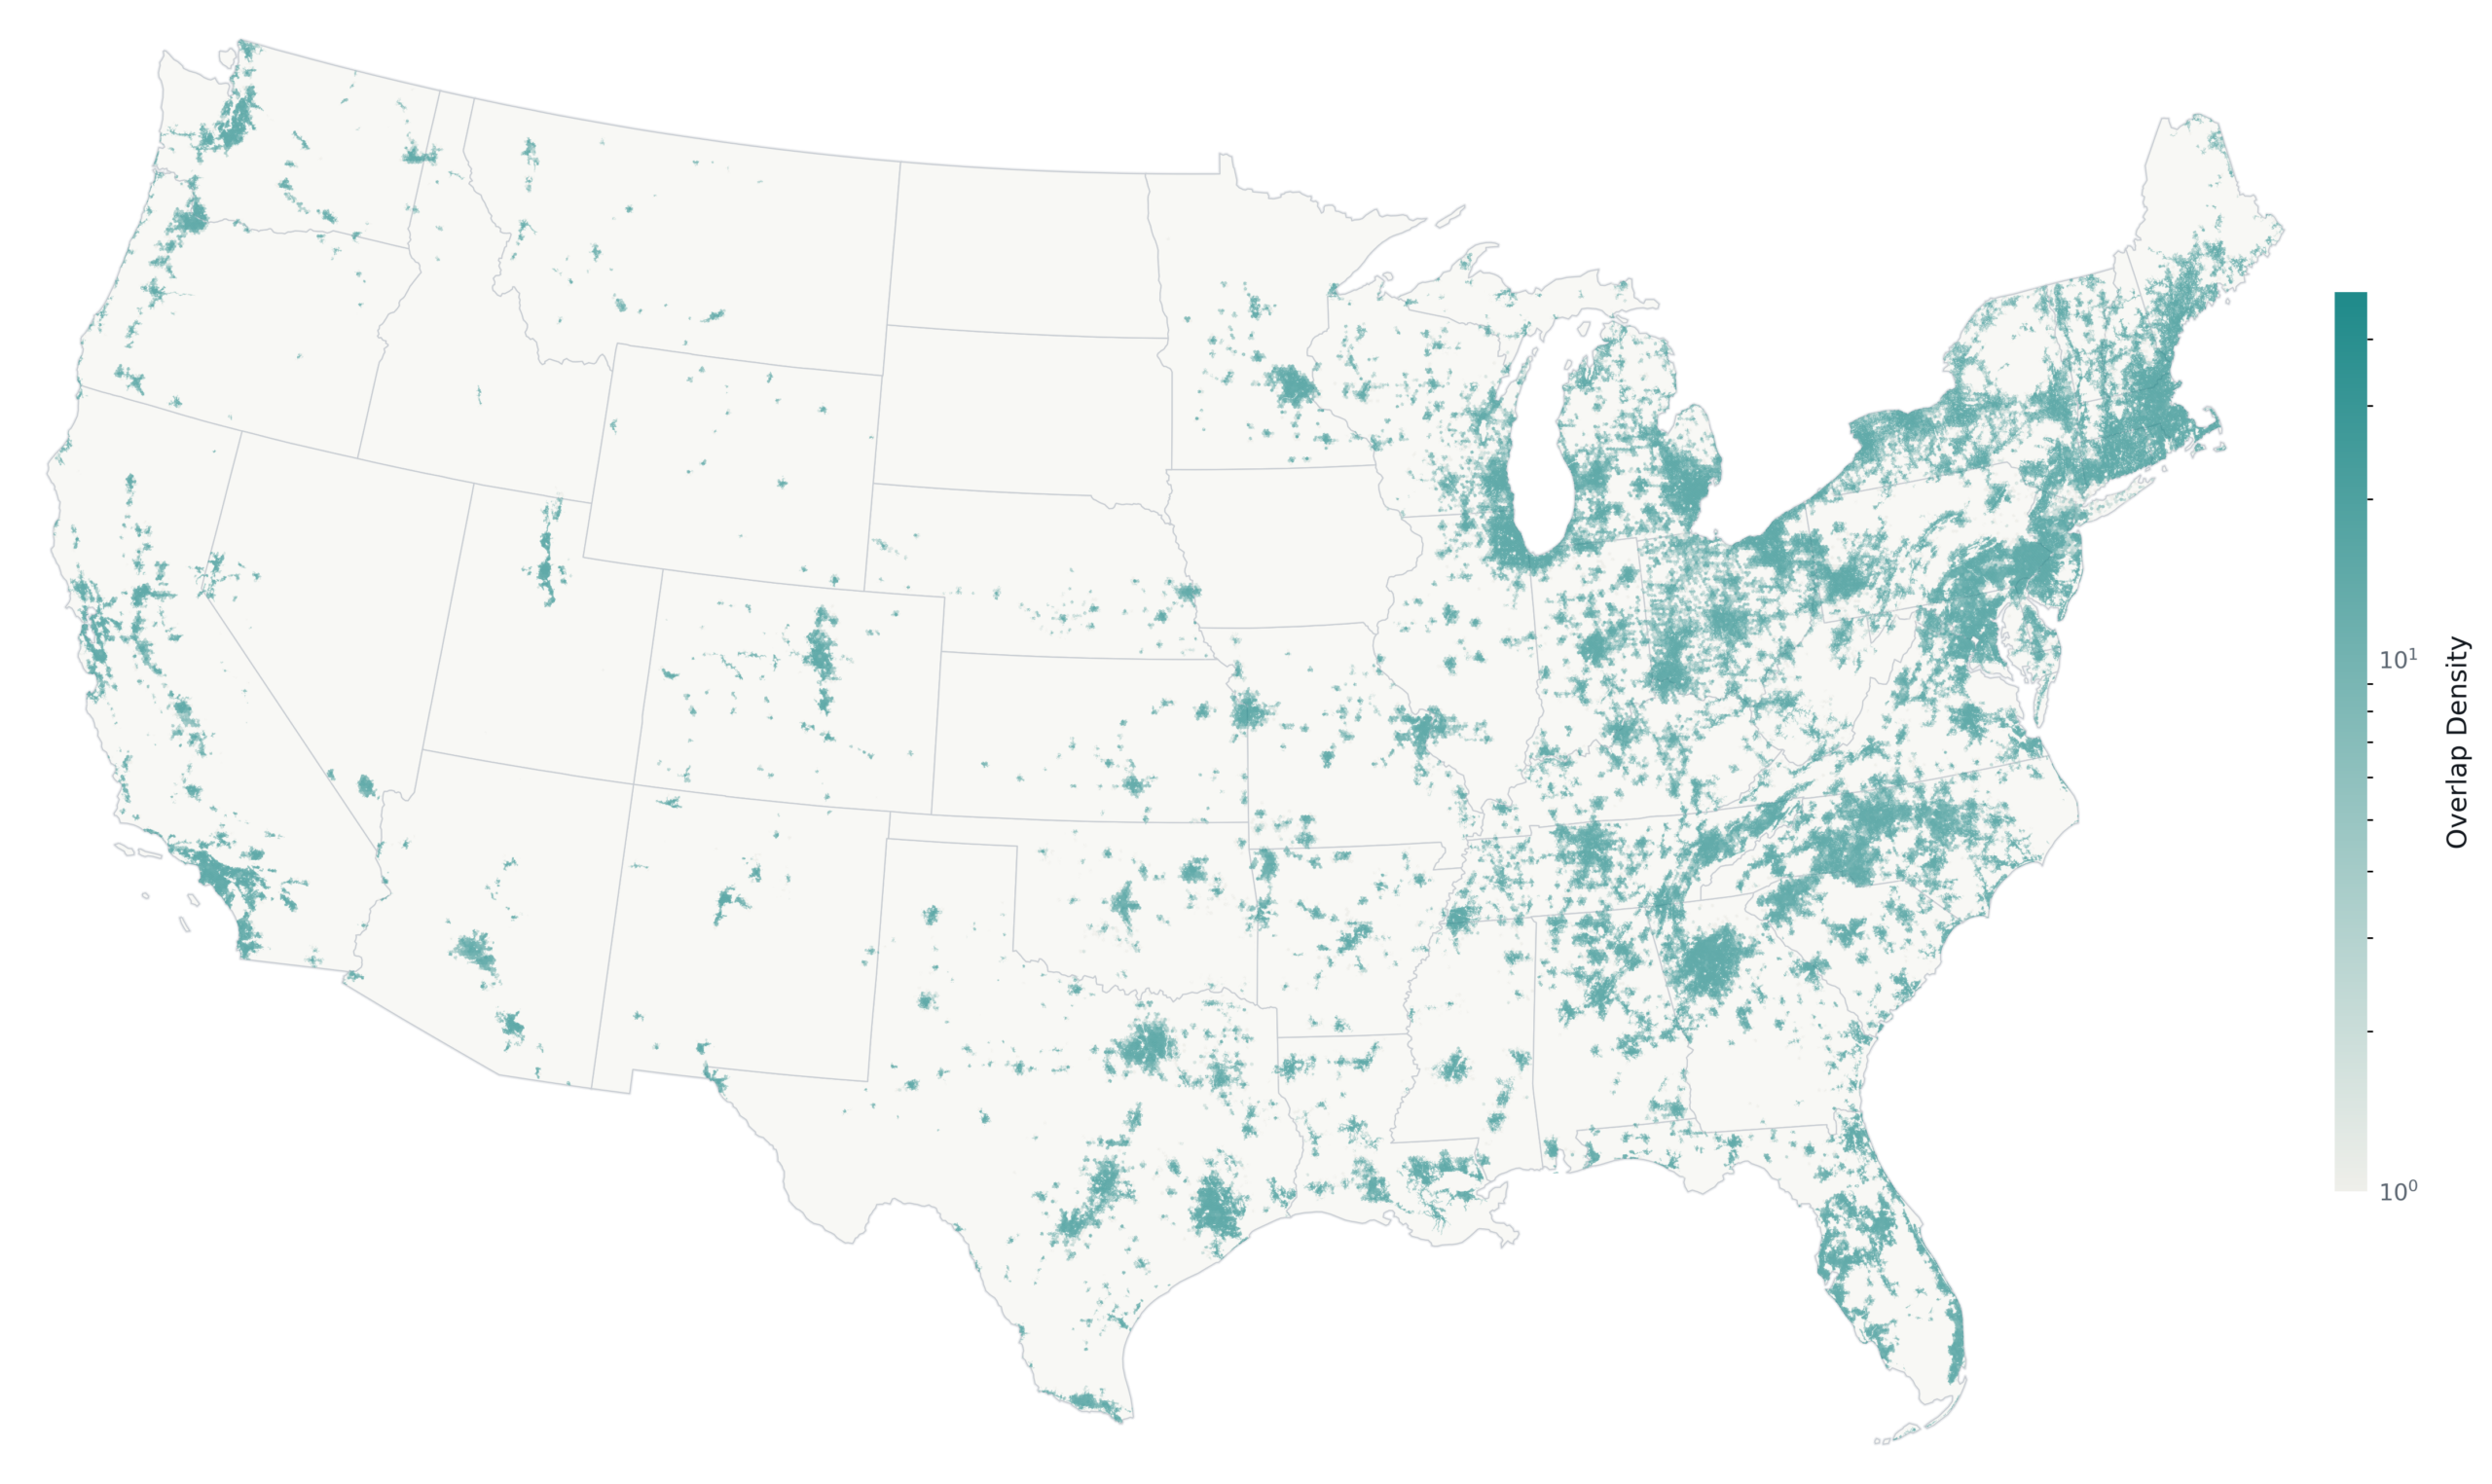
Exhibit 10 — Geographic distribution of cable overbuild activity, D24→J25
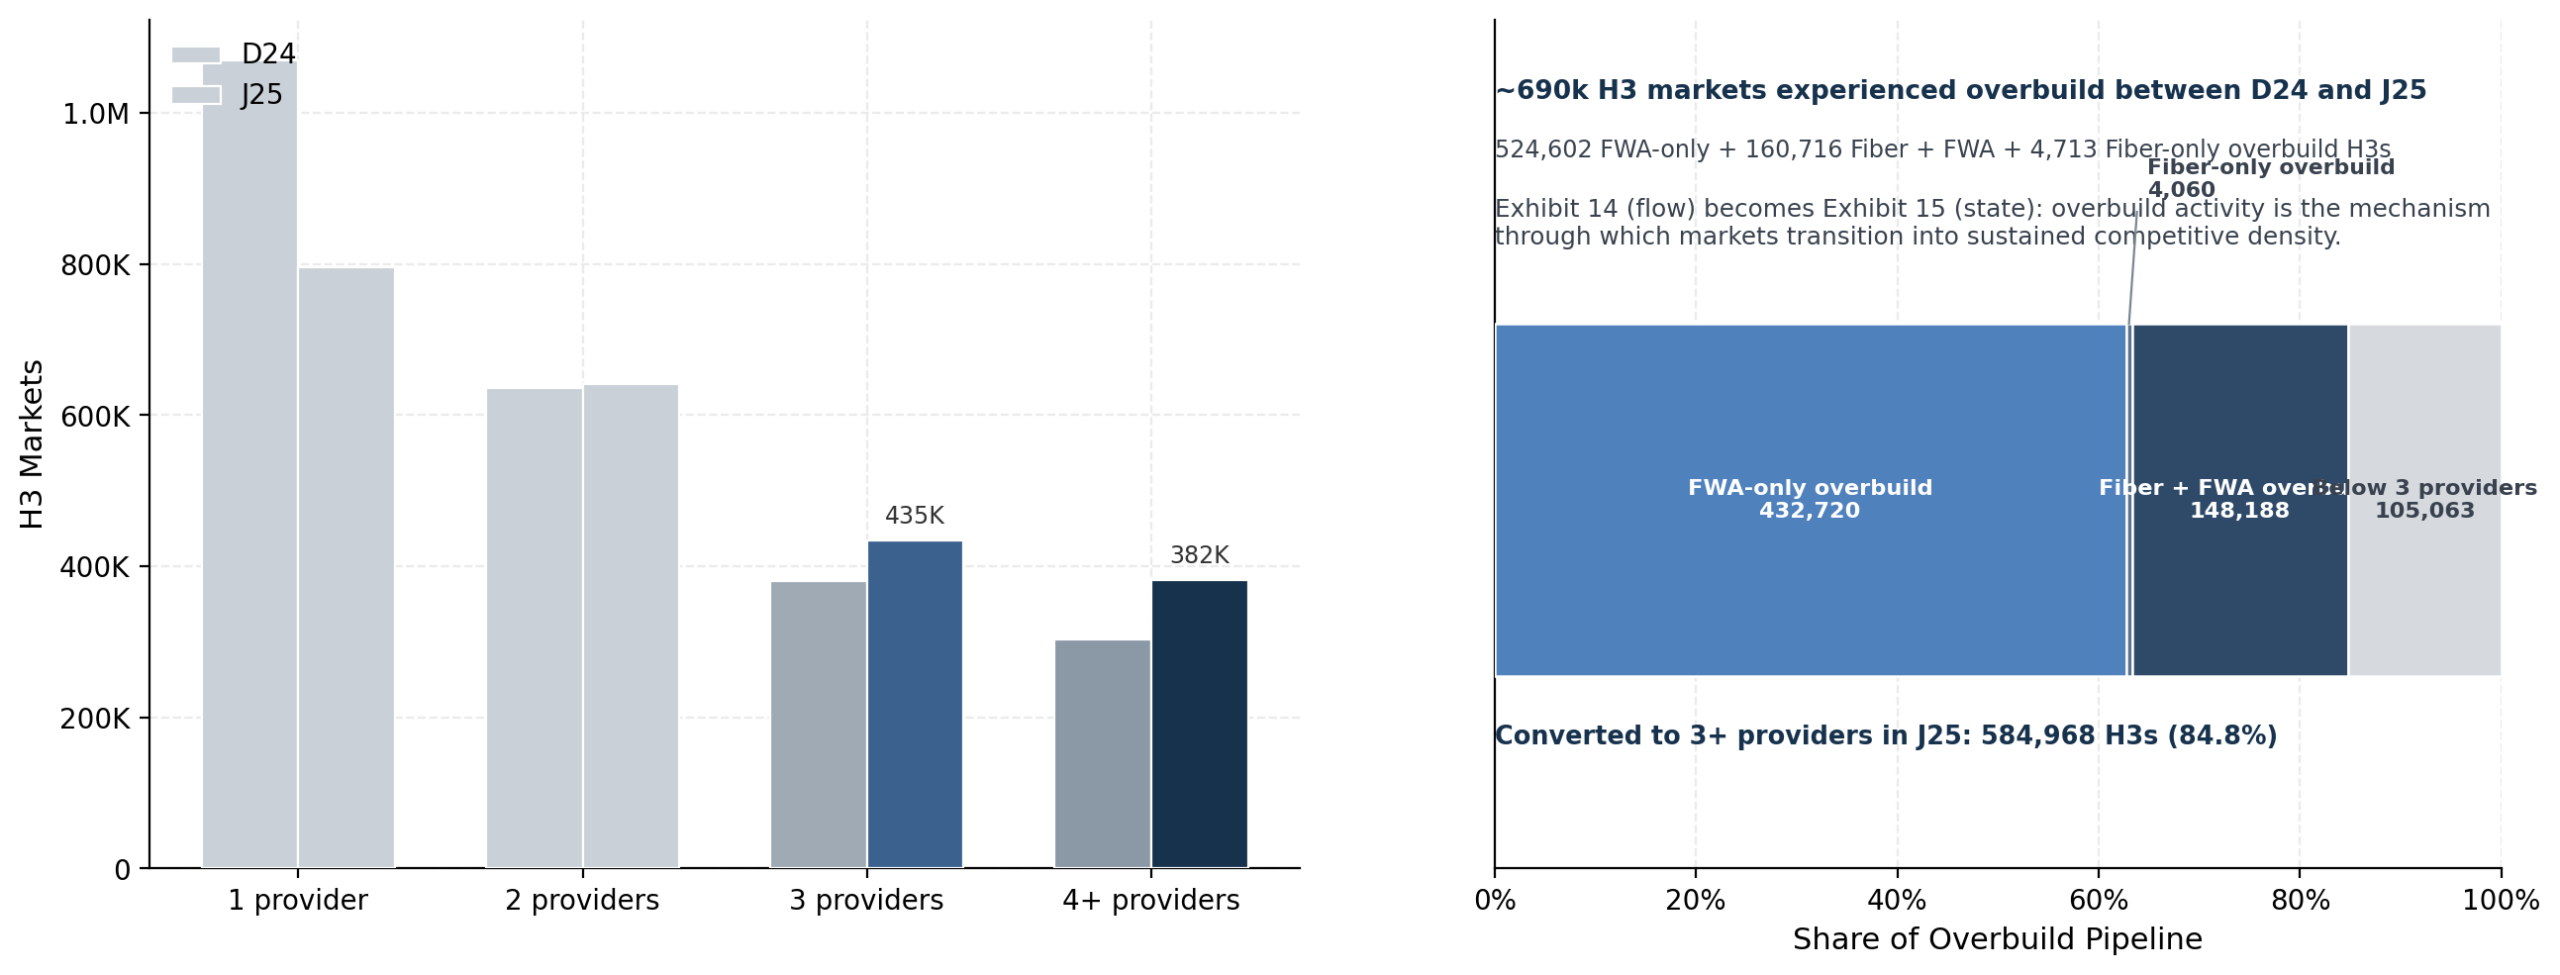
Exhibit 11 — Expansion of 3+ provider markets and state-level migration
Table of contents · 104 pages
Executive Summaryp.1
Key Takeaways1
1.1 Q1 Results Confirmed the Sector Split2
1.2 Our Projection: Cable Losses Narrow, but the Flow Still Goes to Fiber and FWA4
1.3 What Changed This Quarter: Competition Became More Economically Visible4
1.4 Market Structure Is Driving Operator Outcomes5
1.5 Performance Data Reinforce the Competitive Repricing7
Bottom Line8
Market Structure Is Tightening Faster Than Headline KPIs Suggestp.8
2.1 Cable Owns the Base, but Fiber and FWA Still Own the Incremental Flow8
2.2 Network Architecture Defines the Competitive Axes12
2.3 Protected Territory Continues to Shrink14
2.4 Competitive Pressure Is Becoming Economically Visible16
2.5 LEO Satellite: Relevant at the Edge, Not Central to the Core Framework16
Geographic Competition Is Becoming More Concentrated and More Importantp.17
3.1 FWA Is Broadening Competition While Fiber Intensifies It17
3.2 3+ Provider Markets Are Growing Faster Than They Appear21
3.3 Market Stage Determines When KPIs Deteriorate23
3.4 FWA Expansion Is Broad, but the Three Operators Are Not Expanding the Same Way26
Structural Pressure Is Beginning to Reach Reported Resultsp.30
4.1 Architecture, Demand Evolution, and Cable’s Structural Position31
4.2 Two Distinct Growth Models Are Winning Share34
4.3 Similar Markets Are Producing Different Operator Outcomes35
4.4 Reported Metrics Still Lag the Structural Shift, but the Gap Is Narrowing36
4.5 The Read-Through for 2026 Results38
Operator Results Are Separating by Business Modelp.38
5.1 Cable Is Defending the Earnings Base, Not Restoring Growth39
5.2 Hybrid Operators Are Balancing Growth and Resilience40
5.3 T-Mobile Is Turning Industry Pressure Into Share Gains41
5.4 Scale Matters Less Than Business Model Quality43
5.5 The Sector Split Is Already Visible in Reported Results45
Bundle Monetization Determines Whether Subscriber Pressure Becomes Financial Pressurep.46
6.1 FMC Service ARPU Is the Cleanest Comparable Monetization Unit; Broadband ARPU Is a Lagging Indicator47
6.2 Bundles Move Pressure Across the Household Account52
6.3 Capital Efficiency Separates Growth Spending From Defensive Spend54
6.4 The KPI Test: When Subscriber Pressure Becomes Financial Pressure56
Analytical Implications: What the Structural Thesis Has to Confirmp.57
7.1 Cable Stabilization Requires More Than Narrower Losses58
7.2 The Downside Case Is Price Leakage, Not Subscriber Loss Alone59
7.3 AT&T Needs Convergence to Show Up in Returns60
7.4 Verizon’s Fixed Upside Now Depends on Fiber Integration61
7.5 T-Mobile’s FWA Runway Is a Commercial Test62
7.6 The KPI Stack for the Next Quarter63
7.7 Forecast Net-Adds Model: Base, Upside, Downside65
7.8 Operating Quality: What the Structural Thesis Implies for Earnings Durability68
Regulatory & Policy Contextp.70
8.1 BEAD Is Still Alive, but Its Competitive Impact Has Changed70
8.2 ACP Expiration Has Already Repriced Low-Income Demand72
8.3 FCC Posture Has Shifted — and the Shift Has Market Implications72
8.4 Spectrum Policy Shapes Both FWA Capacity and Cable’s Defensive FMC Economics73
8.5 Regulatory Summary: What to Watch74
Methodology & Analytical Frameworkp.76
9.1–9.14 Core data inputs, geographic construction, operator framework, FMC Index, FWA capacity ceiling, ARPU methodology, net-adds model, key assumptions, limitations76–94
Operator-Level Strategic Appendixp.95
10.1 Comcast: Cash-Flow Story With a Price-Realization Problem Developing95
10.2 Charter: Unit-Volume Pressure Across a Distributed, FWA-Exposed Footprint96
10.3 AT&T: The Most Complete Convergence Model, With a Returns Test97
10.4 T-Mobile: Highest-Quality Incremental Growth, Commercial Economics Are the Test98
10.5 Verizon: Materially Changed Fixed Profile, Core Story Still Wireless100
10.6 Relative Positioning Scorecard101
10.7 Forward Watch Items102
10.8 Bottom Line103
About the Authorsp.104
Ready to read the full report?
104 pages · operator-level depth · quarterly cadence
Contact BroadbandSignals.com for pricing information.